
A growing business rarely has a shortage of data.
A SaaS company might use a CRM to manage leads and customers, product analytics to monitor user activity, marketing platforms to measure campaign performance, finance software to track revenue, and customer support tools to understand customer problems.
Every department has its own reports. Managers review dashboards. Teams monitor performance metrics. Leadership receives regular updates.
Yet, when someone asks a straightforward business question, the answers do not always match.
Why are customers cancelling their subscriptions? Which acquisition channel brings in the most valuable customers? Why has product engagement declined? Are operating costs increasing faster than revenue?
Marketing might provide one explanation. Sales might report something different. Product and customer success may have their own interpretations.
The company has plenty of information, but leadership still struggles to establish what is actually happening.
This is a common business intelligence challenge. The problem is not necessarily how much data a company collects. It is whether that data is reliable, connected, understandable, and useful when a decision needs to be made.
Collecting data and making data-driven business decisions are two different capabilities.
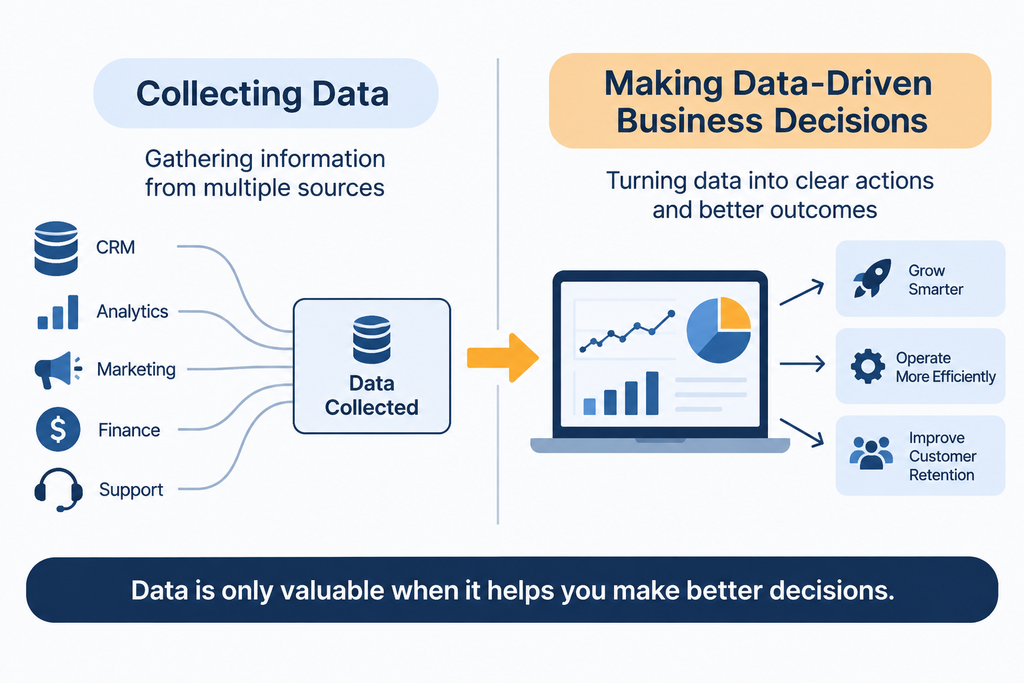
Businesses often invest in more analytics tools, additional dashboards, and increasingly sophisticated reporting systems without addressing the underlying problems that prevent teams from using information effectively.
In this article, we will explore why businesses struggle with data-driven decision making, how disconnected information affects daily operations, and what companies can do to build a more reliable foundation for better decisions.
1. Having Data Is Not the Same as Having Useful Information
Collecting data is relatively straightforward. Turning it into information that supports a business decision requires considerably more thought.
A dashboard can tell a leadership team that monthly recurring revenue has declined. It might show that website traffic has increased or that product engagement is lower than last month.
But those numbers do not automatically explain what happened, why it happened, or what the business should do next.
Consider a SaaS company that notices an increase in new sign-ups.
At first glance, this looks positive. Marketing may report that its campaigns are performing well. However, if most new users never complete onboarding or become paying customers, the increase in sign-ups may not translate into meaningful business growth.
The company needs to understand more than the number of registrations. It needs to connect acquisition sources, activation rates, conversion behaviour, customer segments, and revenue.
That is the difference between reporting activity and supporting a decision.
A business can monitor hundreds of metrics and still struggle to answer five important questions:
- Which customer segments generate the most long-term value?
- Which marketing channels bring in customers who actually stay?
- Where are users abandoning the product?
- Why are operational costs increasing?
- Which business problem should receive attention first?
More metrics do not necessarily create more clarity. In some cases, they make it harder to identify what deserves attention.
Useful business data analytics should help teams move through five stages:
- Collect: Gather information from relevant business systems.
- Organize: Structure information so it can be compared and understood.
- Analyze: Identify patterns, changes, and relationships.
- Interpret: Understand what the findings mean in a business context.
- Act: Use the information to make a decision and evaluate its outcome.
If a company stops at collecting and displaying information, it has not completed the decision-making process.
The purpose of business intelligence is not to produce more reports. It is to help people understand the business and decide what to do.
2. Seven Reasons Businesses Struggle to Make Decisions Despite Having Data
Several underlying problems can prevent a company from turning its available information into reliable decisions. Often, these problems exist together and become more difficult to manage as the business grows.
1. Data Is Scattered Across Disconnected Systems
Most growing businesses rely on multiple software platforms.
Marketing might use HubSpot or another CRM. Finance may work with accounting software. Product teams use analytics platforms. Customer success manages accounts through a separate system, while support teams handle tickets through another application.
Each platform serves a purpose, but the information often remains separated.
For example, marketing can identify where a lead originated, and sales can see whether that lead became a customer. However, connecting that acquisition source to the customer’s product activity, subscription history, support experience, and renewal status may require manual work or custom integrations.
This creates fragmented customer information.
Common consequences include:
- Duplicate customer records across applications.
- Missing relationships between leads, accounts, and subscriptions.
- Different identifiers for the same customer.
- Difficulty connecting operational activity with financial outcomes.
- Repeated manual exports to prepare reports.
Imagine a CEO asking which acquisition channels produce customers who remain subscribed for at least a year.
Marketing may have campaign data, finance may have subscription records, and customer success may have renewal information. If those systems are not connected, answering the question becomes a manual investigation.
The business has the necessary information, but it cannot easily bring the pieces together.
This is why data integration matters. Companies need a way to connect relevant information across systems so teams can understand the full business picture rather than reviewing isolated reports.
2. Different Teams Report Different Numbers
Another common problem is inconsistent metric definitions.
Two departments may use the same term but calculate it differently.
For example:
- Marketing reports the number of leads generated.
- Sales reports qualified opportunities.
- Finance reports recognized revenue.
- Product teams count active users based on product activity.
- Customer success measures active accounts based on engagement with the team.
None of these metrics is automatically incorrect. The problem arises when leadership treats them as interchangeable.
Revenue is a useful example. A sales dashboard might display the value of signed contracts, while finance reports revenue recognized during a particular accounting period. These figures answer different questions.
Similarly, one team might define an active user as someone who logs in during a month. Another might require the user to complete a meaningful product action.
When definitions are inconsistent, teams can spend more time debating which number is correct than understanding what it means.
The solution is not simply to create another dashboard. Businesses need shared definitions for important metrics, clear calculation rules, and agreement about which source is authoritative.
Without that consistency, even accurate reports can lead to conflicting interpretations.
3. Poor Data Quality Leads to Poor Decisions
Connected systems are useful only when the information they contain is reasonably accurate and complete.
Poor data quality can appear in several forms:
- Missing customer details.
- Duplicate records.
- Incorrect contact information.
- Outdated account status.
- Inconsistent product or customer naming.
- Incorrect data entry.
- Missing historical records.
These issues may seem small individually, but they can affect reporting across the business.
Consider a company where the same customer appears under two different account names in its CRM. The finance system records one subscription, while the support platform contains tickets under both names.
When leadership reviews customer activity, the information may suggest two separate accounts rather than one customer with a fragmented history.
This can distort customer counts, account health assessments, and operational reporting.
Poor data quality also creates problems for forecasting. If historical records are incomplete or inconsistent, teams may struggle to identify meaningful trends or compare performance across periods.
Businesses should treat data quality as an ongoing responsibility, not a one-time cleaning exercise.
Validation rules, consistent identifiers, duplicate management, standard naming conventions, and regular quality checks help prevent unreliable information from spreading across reporting systems.
The important point is simple: a sophisticated analytics platform cannot make inaccurate source information trustworthy by itself.
4. Dashboards Show Metrics Without Explaining Business Context
Dashboards are useful for monitoring performance, but they do not automatically explain the reasons behind changes.
Imagine a SaaS dashboard showing that user engagement has declined over the last two months.
The metric identifies a change. It does not explain its cause.
Possible explanations could include:
- New customers are struggling with onboarding.
- A recently released feature has introduced usability problems.
- A particular customer segment is using the product less frequently.
- A change in the product experience has affected user behaviour.
- Previously active customers have stopped using certain features.
Looking at the engagement number alone will not distinguish between these possibilities.
The team needs additional context, such as onboarding completion, feature adoption, customer segments, product release history, and account-level activity.
This illustrates the difference between descriptive reporting and investigation.
A useful dashboard should help decision-makers identify where to look next. It should connect important metrics with the information needed to understand them.
For example, rather than showing only total active users, a SaaS company might examine activation by acquisition channel, customer segment, account size, and onboarding completion.
The goal is not to display every available metric. It is to provide enough context to investigate meaningful changes.
5. Reporting Happens Too Late
Information can be accurate and still arrive too late to support a decision.
Some businesses depend on manual reporting processes. Employees export data from different applications, combine spreadsheets, resolve inconsistencies, and prepare reports for management.
This process can become increasingly difficult as the number of systems and transactions grows.
Consider a COO who needs to understand rising operational costs before approving next month’s budget.
If the finance and operational reports require several days of manual preparation, the decision may be delayed. The leadership team might proceed using incomplete information or rely on assumptions.
Common signs of reporting delays include:
- Repeated manual data exports.
- Multiple versions of the same spreadsheet.
- Time-consuming reconciliation between departments.
- Reports that are updated only monthly.
- Dependence on one employee to prepare critical information.
Automating data pipelines and improving integration between systems can reduce repeated manual work.
However, the objective is not to make every business metric update in real time. Some decisions require daily information, while others can be made using weekly or monthly reporting.
The right reporting frequency depends on the decision being supported.
A useful data analytics strategy considers both accuracy and timing.
6. Nobody Clearly Owns the Data or the Decision
Data ownership is often misunderstood.
A technology team may maintain the database, an analytics team may build reports, and department leaders may use the information. But who is responsible for ensuring that a metric has a consistent definition?
Who investigates missing records? Who approves changes to data access? Who decides what action should follow when a metric changes?
If these responsibilities are unclear, problems can remain unresolved.
It helps to distinguish between technical ownership and business ownership.
Technical ownership covers areas such as:
- Data infrastructure and system reliability.
- Integration pipelines.
- Access permissions and security.
- Data validation and technical monitoring.
Business ownership covers areas such as:
- Defining what important metrics mean.
- Confirming that reports answer relevant questions.
- Interpreting performance in a business context.
- Deciding what action should be taken.
Both are necessary.
For example, the finance leader may own the business definition of recognized revenue, while the engineering or data team is responsible for implementing the reporting logic correctly.
Clear responsibility prevents departments from creating conflicting versions of the same metric and makes it easier to resolve problems when information appears incorrect.
7. Businesses Track Metrics Without Connecting Them to Decisions
Some businesses measure everything because their analytics tools make it easy to collect information.
But not every metric deserves equal attention.
A metric becomes useful when it helps answer a meaningful business question.
Consider the difference between these examples:
| Activity-focused metric | Decision-oriented metric |
|---|---|
| Total website traffic | Qualified pipeline generated by channel |
| Total sign-ups | Activated users who reach a meaningful product milestone |
| Total revenue | Recurring revenue, expansion, and retention |
| Number of support tickets | Resolution time, repeat issues, and customer impact |
| Total feature usage | Feature adoption across valuable customer segments |
The first column provides information about activity. The second connects activity to business outcomes.
For example, increasing website traffic may look encouraging. But if the additional visitors are unlikely to become customers, the business may need to reconsider its acquisition strategy.
Similarly, a high number of product sign-ups does not necessarily indicate successful activation.
Before adding a metric to a leadership dashboard, ask:
- What business question does this metric answer?
- Who needs this information?
- What decision could change based on it?
- What additional context is needed to interpret it?
If a metric does not support a meaningful question or decision, it may not deserve a prominent place in the reporting process.
3. A Practical Example: How Fragmented Data Makes SaaS Decisions Harder
Consider a hypothetical SaaS company experiencing a decline in customer retention.
Leadership wants to understand why more customers are cancelling subscriptions. The company already collects information across several systems, but each department sees only part of the customer journey.
Here is what the different teams can access:
| Department | Information available |
|---|---|
| Marketing | Campaigns, acquisition sources, and lead activity |
| Sales | Deal history, contract details, and customer acquisition |
| Product | Logins, feature usage, and onboarding activity |
| Customer success | Account health, customer feedback, and renewal discussions |
| Finance | Subscription payments, revenue, and cancellations |
Each department can explain what is happening within its own area.
Marketing might report that acquisition campaigns are generating leads. Sales might confirm that new customers are signing contracts. Product might notice lower feature usage among some accounts. Customer success might have records of unresolved customer concerns.
Finance can confirm that cancellations have increased.
But leadership still needs to connect these observations.
Are customers leaving because the company is attracting businesses that are not a good product fit? Are new users struggling to complete onboarding? Are customers failing to adopt important features? Are support problems affecting their experience? Are pricing or commercial expectations contributing to cancellations?
Without connected information, these remain separate investigations.
The company may respond by asking each department to prepare another report. That produces more documents, but it does not necessarily explain the relationship between acquisition, product usage, customer experience, and retention.
Now imagine the company creates a connected view of relevant customer information.
It links acquisition source, account details, onboarding milestones, product activity, support history, subscription changes, and renewal outcomes using consistent customer identifiers.
Leadership can investigate questions such as:
- Do customers from particular acquisition channels have different retention patterns?
- Are customers who fail to complete onboarding more likely to cancel?
- Do accounts with low adoption of key features show different renewal behaviour?
- Are repeated support issues associated with particular customer segments?
- Do cancellations occur more frequently after specific commercial or product events?
The connected data does not automatically prove the cause of churn. It gives the business a more reliable starting point for investigation.
Teams can test explanations, identify patterns, speak with affected customers, and decide where to focus their efforts.
The value of connected data is not that it guarantees the right answer. It helps businesses ask better questions and investigate them with more confidence.
4. How to Build a Reliable Data Foundation for Better Decisions
Improving data-driven decision making does not always require replacing existing systems or investing in an expensive analytics platform.
A more practical approach is to start with the business questions and work backwards.
Step 1: Identify the Business Decisions That Matter
Start by asking leadership and department heads which decisions are difficult to make today.
Examples include:
- Which customer segments generate the most value?
- Why are customers cancelling?
- Which acquisition channels produce retained customers?
- Which product features contribute to activation?
- Where are operational costs increasing?
- Which processes are creating unnecessary delays?
These questions establish what information the business actually needs.
Without this step, companies risk purchasing tools and building dashboards that collect information without supporting important decisions.
Step 2: Identify Where Business Data Lives
Once the questions are clear, map the systems that contain relevant information.
This may include CRM platforms, finance and ERP software, product analytics, marketing platforms, customer support tools, internal databases, and custom applications.
For each system, understand:
- What information does it store?
- Which team is responsible for it?
- How frequently is it updated?
- Which other systems need this information?
- Are there duplicate or conflicting records?
This gives the business a clearer picture of its existing data environment and helps identify integration requirements.
Step 3: Improve Data Quality and Consistency
Before connecting everything, review the quality of the information.
Establish consistent definitions for customers, accounts, subscriptions, revenue, active users, and other important entities.
Use validation rules to prevent incomplete or incorrectly formatted information from entering important systems. Identify duplicate records and establish consistent identifiers so information can be matched across platforms.
Assign responsibility for maintaining critical datasets.
The goal is not to make every record perfect before proceeding. It is to identify and address the data quality problems that could undermine important decisions.
Step 4: Connect Disconnected Systems
Once the business understands its data sources and quality requirements, it can plan how information should move between systems.
This is where data engineering and integration architecture become important.
Some common components include:
APIs: APIs allow software applications to exchange information through defined interfaces. They can help connect systems that need to share customer, transaction, or operational data.
ETL and ELT processes: These processes extract information from source systems, move it into a target environment, and prepare it for analysis. The difference is largely when transformation takes place.
Data pipelines: Pipelines automate the movement and processing of information, reducing the need for repeated manual exports.
Data warehouses: A data warehouse brings information from multiple sources into a structured environment designed for reporting and analysis.
Data transformation: Raw information is cleaned, standardized, and organized so that different systems can be analyzed consistently.
The right architecture depends on the company’s size, existing systems, reporting requirements, security needs, and expected growth.
A smaller business may need a few well-designed integrations. A larger SaaS company with multiple applications and complex reporting requirements may need a more structured data platform.
The objective is to make relevant information available in a consistent form, not to introduce technical complexity for its own sake.
Step 5: Create Metrics That Support Decisions
Once information is connected, establish consistent definitions for the metrics leadership uses.
For example, define what counts as an activated user, a qualified opportunity, a retained customer, and recurring revenue.
Document how each metric is calculated, which systems provide the underlying information, and who is responsible for maintaining it.
Then design dashboards around business questions rather than the number of metrics available.
A leadership dashboard should make it easier to understand performance, identify meaningful changes, and investigate potential problems.
Step 6: Make Data Accessible to the Right People
Connected data should not mean unrestricted data access.
Employees need access to the information required for their roles, but sensitive customer, financial, and operational records must be protected.
Establish appropriate permissions, access controls, security policies, and governance practices.
For example, a marketing manager may need campaign and acquisition information without needing access to detailed payroll or confidential financial records.
A well-designed data environment balances accessibility with security.
The goal is to make trustworthy information available to the people who need it, without creating unnecessary exposure.
5. Why More AI Will Not Automatically Fix Your Data Problems
As businesses explore AI, some expect it to solve existing reporting and information challenges.
They imagine asking an AI assistant a question such as:
“Why are our customers cancelling, and what should we do about it?”
The assistant may be able to generate a useful-looking response. But the quality of that response depends heavily on the information it can access and the reliability of the underlying data.
If customer acquisition records, product activity, support history, and subscription information are stored in disconnected systems, the AI may not have enough context to provide a complete answer.
If records contain duplicate customers, outdated subscription details, or inconsistent definitions, its conclusions may be misleading.
There are several limitations businesses should understand:
AI cannot reliably use information it cannot access. If important data is missing or inaccessible, the system cannot include it in its analysis.
Inconsistent information creates inconsistent outputs. When different systems use conflicting definitions, an AI tool may produce answers that appear confident but are based on incompatible information.
Summaries do not establish accuracy. An AI-generated explanation can make information easier to understand, but it does not automatically verify whether the underlying records are correct.
Access controls still matter. AI systems should only retrieve information that users are authorized to access. Connecting more data without appropriate permissions can introduce security and governance risks.
This does not mean AI has no role in business analytics.
When built on suitable data foundations, AI can help employees search across information, summarize reports, identify patterns, investigate questions, and reduce repetitive analytical work.
For example, an AI assistant could help a customer success manager review account activity, summarize recent support issues, and prepare a customer health overview. The usefulness of that workflow depends on the availability, quality, and permissions of the connected information.
The distinction is important.
Improving data infrastructure and adding an AI interface are not the same thing.
Businesses should first understand how their information is stored, connected, maintained, and accessed. They can then identify where AI offers a meaningful advantage.
Not every reporting problem needs an AI solution. Sometimes the most valuable improvement is simply connecting two systems and agreeing on a consistent metric definition.
6. How to Know Whether Your Business Has a Data Readiness Problem
If leadership regularly questions reports or struggles to get consistent answers, it may be time to assess the company’s data environment.
Use the following questions as a starting point:
- Do different departments report different figures for the same metric?
- Can leadership access a consistent view of revenue, customers, and product performance?
- Does reporting depend heavily on manual spreadsheet work?
- Can the business connect customer acquisition data with retention and revenue?
- Are important records frequently incomplete or duplicated?
- Do teams spend more time reconciling reports than interpreting them?
- Are business decisions regularly delayed because information is unavailable?
- Does the company have clear ownership of important data?
- Can employees access the information they need with appropriate permissions?
- Are important business metrics connected to specific decisions?
If several answers are yes, the business may have underlying data management or integration challenges.
These questions are not a formal scoring model or a substitute for a technical assessment. They help identify where to investigate further.
For example, if teams cannot agree on revenue figures, the issue may involve inconsistent definitions or reporting logic. If employees repeatedly combine spreadsheets from different applications, the business may need better integration and reporting automation.
If customer acquisition cannot be connected to retention, the company may need a more consistent way to identify and track customer records across systems.
The next step is to understand the root cause rather than immediately purchasing another analytics tool.
7. When Should a Business Invest in Data Engineering or Analytics Consulting?
Not every company needs a complex data platform. However, there are situations where internal reporting processes and existing integrations are no longer sufficient.
Consider seeking specialist expertise when:
Multiple business systems need to work together. If important information is spread across CRM, finance, product, and support platforms, integration architecture can help establish a more consistent view.
Data pipelines are unreliable. Regular failures, missing records, and inconsistent updates can undermine reporting. Engineering expertise can help improve pipeline reliability and monitoring.
Reporting requires repeated manual work. If employees spend significant time exporting, cleaning, and combining information, automation may reduce operational effort and reporting delays.
Leadership cannot establish consistent metrics. Businesses may need help designing data models, standardizing definitions, and building reporting architecture that reflects their actual operations.
Existing infrastructure is struggling to support growth. More customers, applications, and transactions can increase the complexity of data management. A scalable architecture can help businesses prepare for changing requirements.
The company wants to prepare for AI implementation. Before connecting AI tools to business information, organizations should understand data quality, access permissions, integration requirements, and validation processes.
This is where data engineering, analytics architecture, and broader technology consulting can provide value.
An experienced technical partner can help evaluate the current environment, identify integration gaps, recommend an appropriate architecture, and prioritize improvements based on business requirements.
For companies that need wider technology leadership while making these decisions, CTO as a Service can also help connect technical planning with business priorities.
The important thing is to invest in the problem that actually exists. A business with inconsistent metric definitions may not need a large-scale data warehouse project. A company with several disconnected production systems may need more substantial integration work.
The solution should follow the business requirement.
Conclusion: Better Business Decisions Start With Better Connected Data
Having more data does not automatically make a business more informed.
Companies can invest in analytics platforms, build additional dashboards, and collect information from dozens of applications while still struggling to answer important questions.
The underlying problem is often fragmented systems, inconsistent definitions, poor data quality, delayed reporting, and unclear ownership.
These issues prevent teams from seeing how different parts of the business connect.
Improving data-driven decision making starts with a more practical approach:
- Identify the business questions leadership needs to answer.
- Understand where relevant information lives.
- Improve data quality and consistency.
- Connect disconnected systems.
- Establish clear definitions for important metrics.
- Make reliable information accessible to the right people.
- Introduce AI where it provides a meaningful advantage.
The objective is not to collect more data or produce more reports. It is to give people the information they need to make better decisions at the right time.
Struggling to turn your business data into actionable decisions?
Enlight Lab helps businesses evaluate their technology environment, connect disconnected systems, build reliable data foundations, and identify opportunities for practical AI implementation.
If your teams are working with fragmented information or struggling to get consistent answers from business data, speak with Dhananjay Goel, Founder and Fractional CTO at Enlight Lab, about the next steps.