
DORA metrics are a set of five research-backed measurements – deployment frequency, change lead time, failed deployment recovery time, change fail rate, and deployment rework rate – used to evaluate how well an organization delivers software. Engineering leaders use them to spot delivery bottlenecks and reliability problems that aren’t visible from a sprint board or a status meeting. Together, the five metrics describe two things: how fast an organization ships changes, and how stable those changes are once they’re in production.
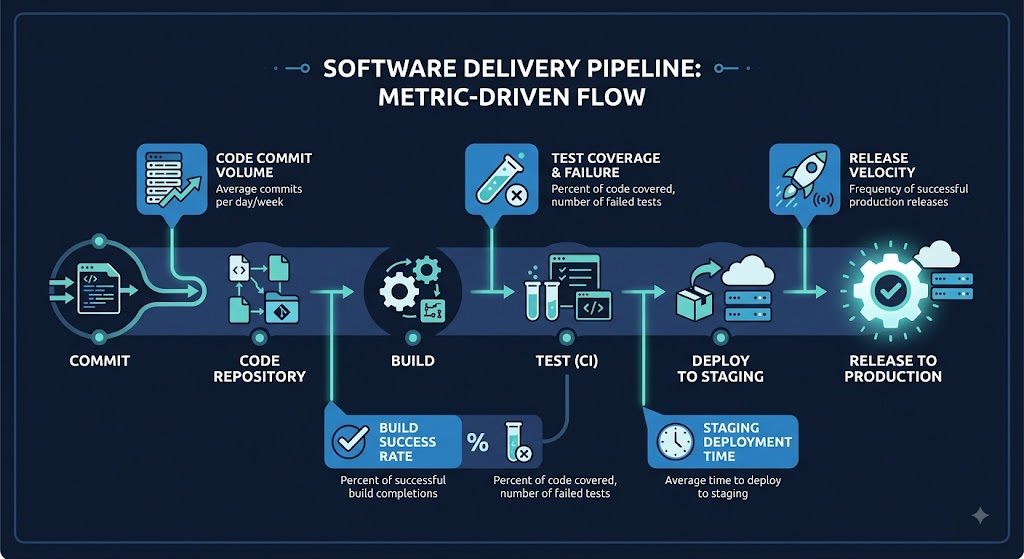
What Are DORA Metrics?
DORA stands for DevOps Research and Assessment, a research program originally run by Nicole Forsgren, Jez Humble, and Gene Kim, later continued under Google Cloud. Since 2014, DORA has studied thousands of engineering organizations to identify what separates high-performing software delivery teams from everyone else. The output of that research is a small set of metrics that correlate with organizational performance – not because they’re arbitrary KPIs someone picked, but because the underlying study found they predict outcomes like profitability, market share, and customer satisfaction.
DORA metrics measure the software delivery system – the combination of process, tooling, and team behavior that turns a code change into a working feature in production. They are not a scorecard for individual developers. A team’s deployment frequency depends on code review norms, test automation, deployment tooling, and release approval processes – not on how many pull requests one engineer opened this week. Any organization that starts pulling per-developer DORA numbers into performance reviews is misusing the framework, and it tends to produce exactly the behavior you don’t want: developers optimizing for the metric instead of for the customer.
What Are the 5 DORA Metrics?
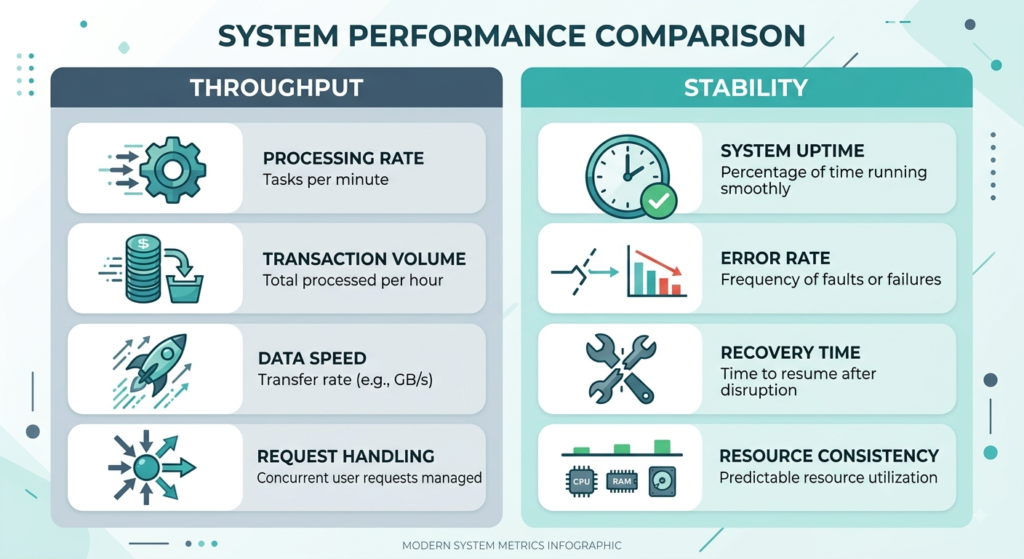
The DORA framework has expanded since its original four-metric version. In 2024, the DORA research team added deployment rework rate, bringing the framework to five metrics grouped into two categories: throughput (how fast changes move) and stability (how well those changes hold up in production).
| Metric | What It Measures | Category | Why It Matters |
|---|---|---|---|
| Deployment Frequency | How often an organization deploys to production | Throughput | Reflects batch size, automation maturity, and release risk |
| Change Lead Time | Time from code commit to successful production deployment | Throughput | Reveals friction in review, testing, and release processes |
| Failed Deployment Recovery Time | Time to restore service after a failed deployment or incident | Stability | Reflects observability, rollback capability, and incident response |
| Change Fail Rate | Percentage of deployments that cause a failure in production | Stability | Signals testing and release-process quality |
| Deployment Rework Rate | Percentage of deployment capacity spent on unplanned fixes for previously “done” work | Stability | Captures hidden instability that change fail rate alone misses |
1. Deployment Frequency
Deployment frequency is the rate at which an organization successfully deploys code to production – measured per day, per week, or per month depending on team maturity.
Calculation: Number of production deployments ÷ time period.
Example: a team that ships 40 production deployments in a 20-business-day month is deploying roughly twice a day. A team that ships once every two weeks is on a biweekly release cadence.
Deployment frequency tells engineering leaders how much batch size and manual gatekeeping is built into the release process. Teams with heavy manual QA cycles or infrequent release trains tend to sit at the low end; teams with strong CI/CD automation and small, incremental changes tend to deploy far more often. On its own, though, a high number only tells you that changes move quickly – not that they move safely, which is why it has to be read alongside the stability metrics.
2. Change Lead Time
Change lead time is the elapsed time from a code commit to that change running successfully in production.
Calculation: Timestamp of successful production deployment − timestamp of the first commit for that change.
Example: a pull request is opened and the first commit lands at 9:00 a.m. Monday. It sits in code review until Wednesday, passes CI, and deploys Wednesday afternoon. That’s roughly 2.5 days of lead time – even though the actual coding work might have taken two hours.
The gap between coding effort and lead time is usually where the real bottlenecks live: slow code review turnaround, oversized pull requests that are hard to review quickly, long-running test suites, manual approval gates, or too many handoffs between teams before a change can ship.
3. Failed Deployment Recovery Time
Failed deployment recovery time measures how long it takes to restore service after a deployment causes a production failure or outage.
Calculation: Timestamp of service restoration − timestamp of failure detection.
Example: a deployment at 2:00 p.m. triggers elevated error rates. Monitoring alerts the on-call engineer at 2:04 p.m. A rollback is triggered and service is restored by 2:19 p.m. – a 15-minute recovery window.
This metric is closely tied to observability and rollback capability. Teams with strong monitoring, clear alerting thresholds, and one-click (or automated) rollback tend to recover in minutes. Teams without those capabilities often spend the bulk of recovery time just figuring out what broke before they can even start fixing it.
4. Change Fail Rate
Change fail rate is the percentage of production deployments that result in a degraded service, an incident, or require a hotfix or rollback.
Calculation: Number of failed deployments ÷ total number of deployments, over a given period.
Example: a team ships 50 deployments in a month and 4 of them require a rollback or emergency fix – a change fail rate of 8%.
Context matters more here than with almost any other DORA metric. An 8% change fail rate might be unremarkable for a fast-moving consumer product team and genuinely concerning for a regulated payments system where a failed deployment has direct financial or compliance consequences. Change fail rate should be interpreted against the risk profile of the system, not compared blindly across teams.
5. Deployment Rework Rate
Deployment rework rate is the newest addition to the framework, introduced in the 2024 DORA research. It measures the share of an organization’s deployment capacity that goes toward unplanned work – fixing bugs, reverting changes, or patching defects – rather than planned feature delivery.
Deployment rework rate differs from change fail rate in an important way: change fail rate captures whether a specific deployment failed, while deployment rework rate captures how much of a team’s overall deployment activity is reactive firefighting versus forward progress. A team can have a moderate change fail rate but still spend a large share of its deployment throughput on rework if failures cluster around a particular service or if fixes themselves introduce new issues.
Engineering leaders should track this metric because it’s often the clearest signal of a delivery process that’s quietly eating its own throughput. High deployment frequency looks good on a dashboard right up until you notice that half of those deployments are patches for last week’s release.
How Do You Calculate DORA Metrics?
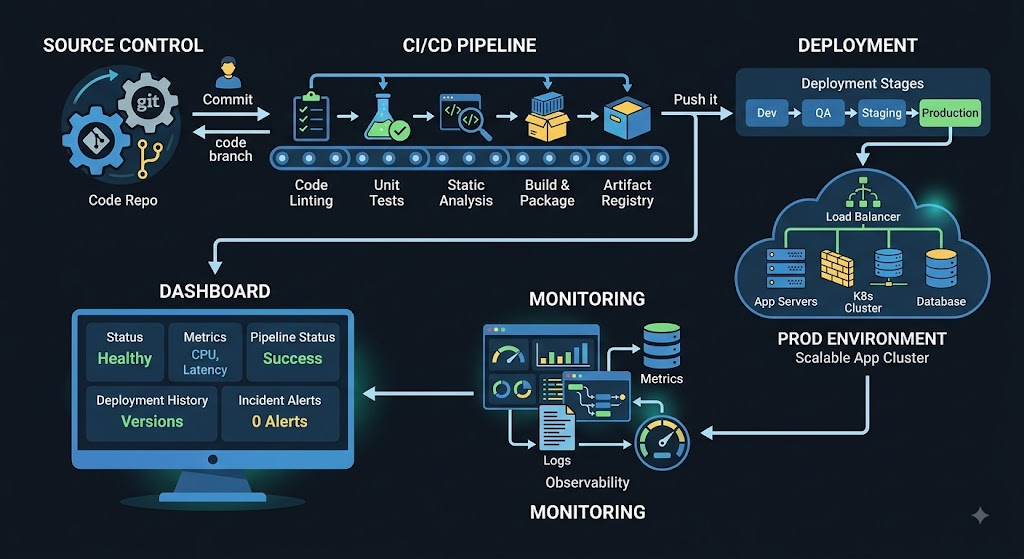
Calculating DORA metrics accurately requires connecting data from your version control system, CI/CD pipeline, and incident management tooling – because no single system holds the full picture on its own.
| Metric | Basic Calculation | Possible Data Sources |
|---|---|---|
| Deployment Frequency | Deployments ÷ time period | GitHub, GitLab, Jenkins, GitHub Actions, GitLab CI/CD, Azure DevOps |
| Change Lead Time | Deploy timestamp − first commit timestamp | Git history + CI/CD pipeline logs |
| Failed Deployment Recovery Time | Restoration time − detection time | Incident-management platforms, monitoring/alerting tools |
| Change Fail Rate | Failed deployments ÷ total deployments | CI/CD pipeline + incident-management platform |
| Deployment Rework Rate | Unplanned/rework deployments ÷ total deployments | Git history, Jira, CI/CD pipeline |
Kubernetes-based environments add another layer worth capturing: deployment events at the cluster level often provide more reliable timestamps than manually logged release notes. Jira (or another issue tracker) is useful for tagging which deployments were planned feature work versus unplanned fixes, which is what makes deployment rework rate measurable in the first place.
The technical integration is the easy part. The harder part is agreeing, across teams, on what counts as a “deployment,” what counts as a “failure,” and what timestamp marks the start of lead time. Without consistent definitions, comparing metrics across teams – or even across time for the same team – produces numbers that look precise but aren’t actually comparable.
DORA Metrics Example
Consider a hypothetical enterprise engineering team running a mid-sized SaaS platform. Over one quarter, their numbers look like this (illustrative figures only, not benchmarks):
- Deployment frequency: rose from roughly 3 deployments/week to 12 deployments/week after adopting feature flags and trunk-based development
- Change lead time: dropped from 4 days to 1.5 days
- Change fail rate: rose from 6% to 14%
- Failed deployment recovery time: stayed roughly flat at 25 minutes
- Deployment rework rate: rose from 9% to 21%
Read in isolation, deployment frequency and change lead time look like a clear win – the team is shipping faster. Read alongside change fail rate and deployment rework rate, a different story emerges: a growing share of that faster throughput is now going toward fixing what just shipped. The team didn’t get faster at delivering value; it got faster at cycling through failures.
This is the core reason DORA metrics are meant to be read together. A team deploying 30 times a day is not automatically healthier than one deploying 10 times a day. If the first team also carries a much higher change failure rate and rework rate, the higher deployment frequency may be hiding a reliability problem rather than demonstrating engineering maturity.
How Should Engineering Leaders Use DORA Metrics?
DORA metrics are most useful as a diagnostic tool for finding where the delivery pipeline is losing time or reliability – not as a report card.
Common bottlenecks that show up in the data:
- Slow code reviews inflating change lead time
- Long-running CI pipelines that discourage small, frequent commits
- Manual deployment steps that cap deployment frequency
- Weak observability that extends recovery time
- Missing or untested rollback paths
- Release processes that bundle too much risk into each deployment
- Recurring production issues that drive up rework rate
The goal is continuous improvement: use a metric trend to identify a likely bottleneck, form a hypothesis about the cause, make a targeted change, and watch whether the trend moves. That loop is very different from setting a deployment-frequency target and telling teams to hit it.
DORA Metrics vs. Developer Productivity Metrics
Are DORA metrics developer productivity metrics? No. DORA metrics measure the performance of a software delivery system – not the output or productivity of individual developers.
Organizations get into trouble when they treat DORA data as an individual performance framework. That typically shows up as:
- Ranking developers by number of deployments or commits
- Setting deployment quotas for individuals or teams
- Rewarding teams for shipping more without accounting for change fail rate or rework
- Optimizing one metric – usually deployment frequency – at the expense of stability
Delivery performance is a property of the whole system: architecture, testing infrastructure, review culture, deployment tooling, and organizational process. Individual developer productivity is a different (and much harder to measure) question that DORA was never designed to answer. Collapsing the two leads to gamed metrics and worse outcomes, which is the opposite of what the framework is for.
How to Improve DORA Metrics
Improve deployment frequency: smaller, more frequent releases; CI/CD automation; feature flags to decouple deploy from release; automated testing to reduce manual gatekeeping.
Reduce change lead time: faster code review turnaround; smaller pull requests; automated testing in the pipeline; fewer approval handoffs; streamlined CI/CD.
Improve recovery time: stronger observability and alerting; automated or one-click rollback; a defined incident response process; progressive delivery patterns like canary releases.
Reduce change fail rate: more automated test coverage; canary or blue-green deployments; pre-deployment validation; infrastructure as code to eliminate manual configuration drift.
Reduce deployment rework: clearer requirements before work starts; better test coverage on the areas that generate repeated fixes; regular release retrospectives; identifying and addressing recurring sources of operational rework.
None of these practices guarantees improvement in every environment – a regulated system with strict compliance gates will respond differently than a greenfield SaaS product. The right combination depends on where the bottleneck actually is, which is why the diagnostic step matters more than the technique list.
DORA Metrics Dashboard – What Should You Track?
An effective DORA dashboard shows more than five current numbers. It should include:
- All five DORA metrics, broken out by service or application
- Trends over time, not just point-in-time snapshots
- Deployment history alongside incident history, so spikes are easy to correlate
- A breakdown by engineering team and environment
- Release-level detail for drilling into a specific spike or dip
Trends matter more than isolated figures. A single week of high change fail rate could be noise; three months of a steadily climbing rework rate is a signal worth acting on. A dashboard that only shows current-period numbers without history makes it hard to tell the difference.
Common DORA Metrics Mistakes
- Measuring individual developers instead of teams or systems
- Treating benchmarks as quotas rather than context for improvement
- Optimizing one metric in isolation – usually chasing deployment frequency while ignoring stability
- Ignoring reliability in favor of speed-only reporting
- Using inconsistent definitions of “deployment” or “failure” across teams
- Manipulating metrics – for example, splitting one release into many small deployments purely to inflate frequency
- Measuring without acting – collecting the data but never using it to change process or prioritize fixes
How to Implement DORA Metrics in an Enterprise
- Define each metric clearly and get agreement across teams on what counts as a deployment, a failure, and a rework event
- Identify data sources – version control, CI/CD, and incident management systems that already hold the raw data
- Connect deployment and incident data so failures can be traced back to the changes that caused them
- Build the dashboard, with trends and drill-down by team, service, and environment
- Review trends regularly and act on bottlenecks – treat the dashboard as an input to planning, not a report that gets generated and archived
Start with one or two teams and a small set of well-instrumented services rather than trying to measure the entire engineering organization on day one. Getting consistent, trustworthy data from a pilot group is more valuable than getting inconsistent data everywhere at once.
What Are Good DORA Metrics Benchmarks in 2026?
Benchmark figures change from year to year and vary significantly by industry, system architecture, and regulatory environment, so any specific numbers should be checked against the latest DORA research (dora.dev) rather than treated as fixed targets.
A few things hold true regardless of the current published figures:
- Architecture matters – a monolith and a microservices platform will naturally have different deployment frequency ceilings
- Regulated industries (finance, healthcare, critical infrastructure) often have different delivery patterns for legitimate compliance reasons, not because the teams are less capable
- Benchmarks are useful for context – are we roughly in the right range for our type of system – not as a quota to hit regardless of trade-offs
- Your own trend over time is usually more actionable than your position on an industry percentile chart, because it controls for your architecture and constraints
Should Your Organization Use DORA Metrics?
DORA metrics are particularly useful when an organization needs an objective, shared language for delivery performance – startups scaling their first platform team, growing engineering organizations trying to standardize practices across squads, enterprises running formal DevOps transformation programs, and platform engineering teams building internal tooling for other developers.
They’re less useful, at least in a formal dashboard sense, for a very early-stage team of two or three engineers shipping to a handful of users. At that size, the overhead of building pipelines, standardizing definitions, and maintaining a dashboard usually outweighs the insight gained – the team already has direct visibility into what’s slow or breaking. DORA measurement earns its keep once delivery involves enough people, services, or complexity that intuition alone stops being reliable.
Conclusion
DORA metrics are a feedback system for software delivery, not a scorecard for individual developers. The five metrics – deployment frequency, change lead time, failed deployment recovery time, change fail rate, and deployment rework rate – only pay off when they’re used to find and fix real bottlenecks in engineering workflows, CI/CD, deployment practices, reliability, observability, and developer experience. A dashboard full of green numbers means little if no one is using the trends to change anything.
Enlight Lab works with engineering leaders on exactly this kind of software delivery measurement and improvement – from wiring up the underlying data pipeline to helping teams interpret what the trends are actually telling them. If you’re trying to figure out where your delivery process is losing time or reliability, that’s a conversation worth having.